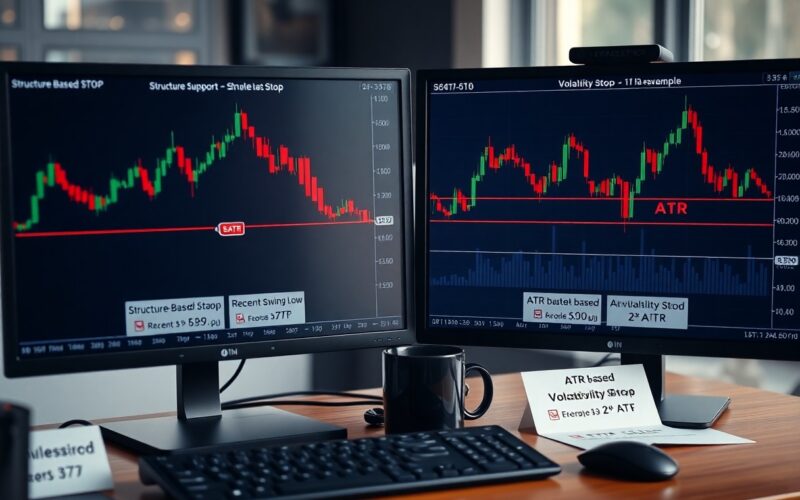
Most traders rely on guesswork, but you can improve your risk control by choosing between structure-based and volatility stops: structure-based stops sit beyond swing highs/lows – e.g., place your stop just below the prior swing low – giving logical trade invalidation, while volatility stops use ATR multiples – e.g., 2× ATR – to avoid market noise. Avoid placing overly tight stops because they can be hit by normal price oscillation, costing you trades and capital.
Understanding Stop-Loss Orders
Definition of Stop-Loss Orders
You place a stop-loss order to instruct your broker to exit a position once the market hits a specified price, converting a planned loss into an executed exit. For example, if you buy a stock at $100 and set a stop at $92, your order triggers when the market trades at or through $92, aiming to limit loss to roughly 8% (though slippage can widen that in fast markets).
Stop orders come in variants: a simple stop (market) order becomes a market order when triggered, while a stop-limit order becomes a limit order that may not fill if prices gap past your limit. You must weigh execution certainty against price control when you choose the variant.
Importance of Stop-Loss Orders in Trading
Stops are a primary tool for preserving capital: you can define a maximum loss per trade (commonly 1-3% of your account) so a single setback doesn’t derail your strategy. In practice, traders who cap losses at 2% per trade can sustain a long sequence of losing trades and still remain solvent provided their winners exceed losers in risk-reward ratio.
Stops also force discipline by converting an emotional decision into a rule-based one; they keep you from holding through adverse moves hoping for a reversal. For instance, institutional risk guidelines often require stops on every position and limit aggregate drawdown to a predefined percentage of NAV.
You can refine stop placement with methods like structure-based stops (below clear support) or volatility-based stops (e.g., 2x ATR); each approach shifts where you place the stop and how often it will be hit. This helps you align stop choice with trade duration, timeframes, and the volatility profile of the instrument.
| Risk Management | Limits loss per trade (e.g., 2% of account) |
| Position Sizing | Enables sizing so a stop at $X equals desired risk in dollars |
| Emotion Control | Removes discretionary exit decisions under stress |
| Execution Certainty vs Price Control | Stop-market = fill but possible slippage; stop-limit = price control but no fill |
| Portfolio Protection | Caps drawdown and preserves capital for future opportunities |
- Capital protection: stops prevent oversized losses that compound over multiple trades.
- Discipline: you enforce a trading plan instead of reacting to fear or hope.
- Consistency: defined exits make performance evaluation meaningful.
This alignment between rules and risk lets you measure and improve your edge.
Common Types of Stop-Loss Orders
Market stops trigger a market order at the trigger price, giving you execution but exposing you to slippage; stop-limit orders trigger a limit order, which preserves price but can leave you exposed if the limit doesn’t fill. Trailing stops move with the market-typically a fixed percentage or ATR multiple-locking in gains while allowing room for continuation.
Volatility stops use indicators like the ATR to set a buffer (e.g., 2× ATR (14)) so you avoid being stopped out by normal noise; structure-based stops sit beyond technical levels (support, trendlines) so you exit only when the structure breaks. Time-based stops close a trade after a set duration when the thesis hasn’t resolved.
You should match stop type to your setup: use structure-based stops for breakout trades, volatility stops for swing trades in choppy markets, and trailing stops to protect winners in trending positions. This tailoring reduces false exits while protecting capital.
| Market Stop | Becomes market order at trigger; high fill probability, potential slippage |
| Stop-Limit | Becomes limit order at trigger; price control, risk of no fill |
| Trailing Stop | Follows price by fixed % or ATR; locks profits while allowing run |
| Volatility Stop | Based on ATR or volatility band (e.g., 2× ATR(14)) to accommodate noise |
| Structure-Based Stop | Placed beyond support/resistance or trendline to confirm structural failure |
- Market stop: fastest execution, worst-case slippage in gaps.
- Stop-limit: you keep control of price, but you might not exit when needed.
- Trailing stop: protects gains during trends but can chop you out in volatile moves.
This forces you to decide whether execution certainty or price control matters more for the specific trade.
What is Structure-Based Stop Placement?
Definition and Explanation
Structure-based stop placement means you set your stop-loss based on identifiable price structure – swing highs/lows, support and resistance clusters, trendlines, supply/demand zones and prior consolidation highs or lows – rather than an arbitrary pip/point distance. You place the stop just beyond the level that, if hit, would invalidate your trade idea; for example, if a daily swing low sits at 1.1200 on EUR/USD you might place your stop at 1.1185 (15 pips) to stay beyond the obvious low and avoid common intraday noise.
When you use structure, timeframe matters: a stop beyond a weekly swing low requires a wider buffer than one beyond a 5-minute micro-swing. For equities, that might mean placing a stop 2-4% below a multi-week support level (e.g., buy at $150, stop at $144 for a 4% buffer), while for FX you often use pip buffers tied to the visible swing width rather than a fixed ATR multiple.
Key Principles of Structure-Based Stops
Anchor the stop to an explicit invalidation point so the stop has a logical reason for existing; this is the point where the trade thesis no longer holds. You must size position risk to your account rules (commonly 1-2% of account equity per trade) so placing a wider structure-based stop simply means you reduce position size rather than ignoring the structure.
Seek confluence: align a swing low with a horizontal support, a trendline and a moving average or previous daily high to justify a tighter stop; if only one small support exists you widen the buffer. For example, if a weekly swing low spans ~40 pips on EUR/USD, you might set your stop at ~45-50 pips to clear the zone plus a safety buffer.
Manage the stop dynamically as the market moves: move to breakeven after price reaches the next structural level or a 1:1 R:R, and trail the stop behind successive higher lows (or lower highs) to lock profits while keeping the stop structure-based rather than arbitrary.
Benefits of Structure-Based Stop Placement
Using structure reduces emotional decision-making because your stop has a documented, market-derived rationale – this helps you hold through normal retracements and prevents you from moving stops without cause. It also improves trade consistency: when you pair structure-based stops with position sizing rules (risk ≤ 2% per trade), you control both the reason for an exit and the monetary impact.
Structure-based stops protect you from common whipsaws that would trigger a tight, volatility-based stop; for markets with intraday spikes (e.g., EUR/USD typical intraday moves of 20-30 pips), anchoring to a visible swing low prevents frequent stop-outs and lets you capture larger directional moves.
Psychologically, structure-based stops increase discipline: you can objectively explain why a stop exists (invalidation), which reduces the urge to hedge, move the stop, or overtrade after a loss.
Examples of Structure-Based Stops
Common setups include: placing a stop 10-30 pips below a daily swing low in FX (e.g., daily low 1.1200 → stop at 1.1175-1.1185 depending on volatility), setting a stop below the base of a multi-week consolidation in equities (buy at $50 → stop below consolidation low at $46, ~8% down), or putting a stop just beyond a trendline where multiple touches define support.
Intraday example: on a 5-minute breakout you identify support at 1.3050 with ATR(14) ~12 pips and typical spread 2 pips, so you place your stop ~8-12 pips below the support (buffering for spread and micro-noise) rather than a fixed 20-pip rule. For a weekly structure, widen the buffer proportionally – a weekly swing zone of 100 pips might need a 110-120 pip stop.
Combine structure with a volatility-derived buffer for precise placement: if ATR(14) on the 1-hour chart is 25 pips, set the stop beyond the swing low plus ~1.2×ATR (~30 pips) to clear normal volatility while staying tied to the structure – this preserves the structural logic while reducing false exits.
What are Volatility Stops?
Definition and Explanation
You set volatility stops based on how much price typically moves, not on recent swing highs or lows, so the stop adjusts to market conditions rather than a fixed chart level. Common implementations use the Average True Range (ATR)-for example, an ATR(14) multiplied by 1.5-3x to place the stop beyond normal noise-while others use Bollinger Bands (usually ±2σ) or volatility models derived from implied volatility.
Using volatility to size your stop means you give the trade breathing room during high volatility and tighten it when the market calms, which reduces the chance of being stopped out by routine fluctuations. You’ll frequently see traders pair a volatility stop with position sizing rules so that a wider stop automatically reduces position size, keeping absolute risk per trade constant.
Factors Influencing Volatility Stops
Timeframe and instrument matter: intraday traders often use ATR(14) on 5- or 15-minute charts with multipliers around 1-1.5×, while swing traders may use daily ATR and 2-3× multipliers to avoid being whipsawed by daily noise. You must also account for scheduled events-earnings or macro prints-that temporarily inflate volatility; a static multiplier may be inappropriate around those dates.
Volatility regime shifts and liquidity are also key. In thinly traded stocks or during market stress (for example, when the VIX spikes above 30), you’ll need wider stops or alternative exit rules because price gaps and slippage become more likely. Conversely, in low-volatility regimes a tighter volatility stop preserves capital and limits drawdown.
- Average True Range (ATR) – measures historical price range used to set stop distance.
- Bollinger Bands – uses standard deviation around a moving average to define expected range.
- Implied Volatility – option-market expectations that can inform wider or tighter stops.
- Timeframe & Liquidity – shorter timeframes and thin markets generally require different multiples.
- Perceiving how these factors interact helps you choose an appropriate multiplier and avoid premature exits.
You should monitor volatility parameters continuously: backtest ATR multipliers over the exact instrument and timeframe you trade, and track how frequently a chosen stop is hit versus the trade’s profit targets to validate the risk/reward profile.
- Backtest results – confirm multiplier effectiveness for your strategy and timeframe.
- Event risk – earnings, FOMC, or data releases can invalidate normal ranges.
- Spread & Slippage – larger spreads require wider stops or adjusted execution assumptions.
- Perceiving the combination of these elements lets you manage position size and expected hit rates more reliably.
Benefits of Using Volatility Stops
You gain an adaptive exit that aligns with current market dynamics: volatility stops reduce the likelihood of being stopped out during routine noise while preventing oversized losses when volatility expands. Traders using ATR-based stops often report smoother equity curves because the stop scales with market rhythm instead of being fixed at arbitrary price levels.
They also integrate naturally with risk management: a wider stop automatically reduces position size if you cap risk per trade, which enforces consistent dollar risk across varied volatility environments. That structure is especially valuable when trading volatile sectors like biotech or small caps where intraday ranges can vary 3-5x over weeks.
More deeply, volatility stops help you avoid common pitfalls such as placing stops too close to the entry in a high-noise market or too far in a low-volatility environment, improving your trade survival rate and letting your edge play out.
Examples of Volatility Stops
A practical example: you enter a long on a daily chart with ATR(14)=0.80; using a 2× ATR stop places your exit 1.6 points below entry. If you risk $1,000 per trade, the position size is calculated so that 1.6 points equates to that $1,000 risk. On a 5-minute scalp where ATR(14)=0.05, a 1.25× ATR stop equals 0.0625, which gives you a tighter, timeframe-appropriate exit.
Another example uses Bollinger Bands: short-term mean-reversion traders may place stops just outside the 2σ band-if price closes beyond the band and the band is widening, that stop adapts to increasing volatility. For options-driven strategies, you might widen stops when implied volatility rises above historical vol by a certain percentage, for instance when IV exceeds HV by 20%.
For added nuance, combine a volatility stop with a time-based exit (e.g., if the trade hasn’t hit target in X days) to reduce exposure to structural regime changes and manage capital turnover more predictably.

Comparing Structure-Based Stops and Volatility Stops
| Structure-Based Stops | Volatility Stops |
|---|---|
| Placement logic: You place the stop just beyond a clear support/resistance level (swing low/high, trendline, order block). | Placement logic: You place the stop based on a volatility metric (ATR, historical std dev), often a multiple like 1.5×-3× ATR. |
| Typical distance: Often tight – e.g., 0.5%-1.5% on equities, a few pips on forex – depending on visible structure. | Typical distance: Wider and adaptive – commonly 1.5%-4% on equities or 1-3× ATR (e.g., ATR(14)=60 pips → 120-180 pip stop). |
| Pros: Improves R:R by keeping risk small; aligns with technical invalidation; easier to size positions. | Pros: Reduces stop-outs from noise; adapts to changing market regimes; more consistent expectancy across instruments. |
| Cons: Vulnerable to micro-structure noise and stop-hunts; requires clean, readable structure that isn’t always present. | Cons: Larger stops increase position size friction and capital at risk; may blunt returns if trend reversals hit the wider stop. |
| Best for: Setups with clear swing points, range breakouts, or when you need tight risk control (scalping, short-term swing). | Best for: Volatile instruments, news-driven environments, longer-term trades where you want to give price room to breathe. |
| Example: Enter long at 100; visible swing low at 95 → stop just below at 94.5 (~5.5% risk) or a tighter 98.5 if micro-structure supports it. | Example: Enter long at 100; ATR(14)=1.8 → 2×ATR = 3.6 → stop at 96.4 (~3.6% risk), which survives normal intraday volatility. |
Key Differences Between the Two Approaches
You rely on structure-based stops to invalidate the trade idea: price closing below a swing low or breaking a trendline is your signal that the bias failed, so the stop sits just beyond that point. That typically gives you a tighter, behavior-driven stop – for example, placing a stop 0.5-1.5% from entry on a stock with a clearly defined support area.
By contrast, volatility stops are mathematical and adaptive: they don’t care where the support or resistance sits, they respond to how wild price action currently is. When ATR expands from 1% to 2% you automatically widen the stop (e.g., from 1.5% to 3%), which reduces the chance of being stopped out by regular market noise but raises the dollar amount at risk per trade.
Risk Management Considerations
When you use structure-based stops, you can typically size positions larger because the stop distance is often smaller; that improves potential return on capital but increases the chance of short-term stop-outs from liquidity hunts or spike tails. If you risk 1% of equity per trade, a structure stop that is 0.8% away allows a bigger position than a volatility stop at 2.4% away – but you must accept a higher frequency of small losses.
With volatility stops you lower the frequency of whipsaw exits, which can preserve larger winning runs, yet you raise the absolute risk per trade. That forces you to either reduce position size or accept higher drawdown potential: for example, shifting from a 0.8% structure stop to a 2.4% volatility stop typically requires cutting position size by ~66% to keep the same 1% equity risk.
Additionally, you should combine both approaches in position-sizing rules: use volatility to set a baseline stop width, then nudge the stop outside nearby structure so you avoid being stopped by a legitimate breakout – this hybrid method helps you control both the probability of being stopped and the dollar risk you carry into trades.
Market Conditions Appropriate for Each Method
In low-volatility, range-bound markets you’ll find structure-based stops superior because support/resistance levels are respected and noise is limited; you can place stops tight, preserve capital, and earn favorable R:R. For example, mean-reversion trades on a stable large-cap (daily ATR ~0.8%) often work well with stops 0.5%-1% away, letting you size up without inviting large drawdowns.
When markets are choppy, trending strongly, or subject to news shocks, volatility stops serve you better: they expand with ATR so you don’t lose positions to normal expansion. Trading a commodity with daily ATR that jumps from 1.5% to 3% around reports means a fixed structure stop would be hit frequently; a 2×ATR stop will keep you in legitimate trends.
For practical deployment, you can switch by instrument and time frame: use structure stops on intraday setups in liquid stocks, and volatility stops on weekly swing trades or in FX pairs around macro releases – that gives you discipline while adapting to the environment.

Strategies for Effective Stop-Loss Placement
Assessing Market Structure for Stops
When you read the chart, prioritize recent swing highs and lows, trendlines, and consolidation boundaries as your primary stop anchors. For example, in a trending equity, placing a stop just below the prior swing low that formed two weeks ago gives the trade room to breathe; if that swing low is at $48.50 and price is $52.00, a stop at $48.00 or $47.75 sets a clear invalidation. Using structural anchors reduces the chance of being stopped by routine intraday noise while keeping the stop tied to a logical break in market intent.
Pay attention to timeframes: a swing low on the daily chart carries much more weight than one on the 15‑minute chart, so you’ll need a wider stop and smaller position size when relying on higher‑TF structure. If you use order flow or volume nodes, placing stops beyond a high‑volume node or a visible rejection wick further lowers the probability of a false exit; placing stops inside well‑traded support is one of the most dangerous mistakes because it frequently results in stop hunts and repeated whipsaws.
Calculating Volatility for Stops
Use a standard 14‑period ATR to quantify typical price movement and convert it to a stop distance: many practitioners use 1.5×-2.5× ATR depending on the instrument and your holding period. For instance, if EUR/USD 14‑ATR = 0.0045 (45 pips), a 1.5× ATR stop places you ~68 pips from entry; a 2× ATR stop is ~90 pips. Set position size so that the dollar risk equals your predefined limit (e.g., 1% of account) after applying that ATR‑based distance.
Shorter timeframes require smaller ATR multipliers because microstructure noise dominates; for scalps you might use 0.8×-1.2× ATR on a 5‑minute ATR and tighten your time‑based exit rules. Conversely, swing trades on the daily chart often need 2×-3× ATR to avoid being stopped by normal volatility swings; using too tight a volatility stop on a high‑ATR instrument is likely to flush you out repeatedly.
More info: combine ATR with expected market events-if an FOMC, earnings release, or known economic shock is within your holding window, expand the ATR multiplier (e.g., add 0.5×-1.0× ATR) or avoid initiating the trade; that reduces stop churn around scheduled volatility spikes and keeps your risk model aligned with real‑world event risk.
Combining Both Methods for Optimal Results
Anchor your stop to market structure first, then use volatility as a buffer: set the stop beyond a structural invalidation zone by adding an ATR‑based cushion. Example: a stock with a swing low at $150 and a 14‑day ATR of $3 – placing the stop at $150 − 1.5×ATR = $145.50 ties your exit to price action while accounting for typical movement. That approach preserves the logical stop location and quantifies how much extra room you need to avoid random noise.
Translate that combined stop distance into position size so your capital at risk remains consistent: if your account equity is $100,000 and you risk 1% per trade ($1,000), entering at $160 with a stop at $145.50 means your share size = $1,000 / ($160 − $145.50) ≈ 71 shares. Failing to adjust position size after widening a structural stop is a common source of oversized losses.
More info: test the combined rule set across market regimes-backtest separately for trending versus choppy months and measure stop hit rates and average loss multiples; if structure+ATR produces fewer false exits and a better win/loss ratio in trend months but underperforms in choppy markets, adapt by reducing ATR multiplier or switching to tighter range‑based stops during low directional conviction periods.
Monitoring and Adjusting Stops
Define objective rules for when you move stops: common rules are moving to breakeven after a 1R gain, trailing by 1× ATR after a 2R gain, or tightening to just below the most recent higher low in an uptrend. For intraday trades you might adjust every 30-60 minutes; for swing trades review stops at end of each trading day or after key price structure changes. Use automation where possible to avoid emotional tightening that cuts winners short.
Track metrics such as average stop distance, frequency of stop hits, and outcome after stop adjustment; if you find 40% of stopped trades reverse and run to targets, that signals your stops are too tight or poorly placed relative to structure. Conversely, if stopped trades produce losses significantly larger than average win size, your trailing method may be too loose and you should shorten the trailing interval or reduce ATR buffer.
More info: implement a post‑trade review checklist-log the stop rationale (structure anchor, ATR multiplier), the triggering event for stop movement, and whether the adjustment preserved the trade thesis; over 50 reviewed trades you’ll see patterns enabling clear rule tweaks (e.g., move to breakeven at 0.8R instead of 1R for a specific setup) and reduce subjective stop management.
Summing up
Conclusively, you should match your stop type to the trade context: use structure-based stops when you want to protect against pattern failure by placing your stop just beyond a swing low/high or support/resistance (for example, buying at 100 with a recent swing low at 95 could warrant a stop near 94.5), and use volatility stops when you need the market’s noise baked into the exit (for example, with ATR = 2 and a 2×ATR stop you would place a stop 4 points away, so a 100 entry has a stop at 96). Structure stops guard the integrity of the pattern; volatility stops scale with changing market conditions.
You can combine methods and manage risk: size your position to the stop distance (e.g., risking 1% of your account with a 4‑point stop determines position size), initially use a volatility buffer then tighten to a structure stop once the trade proves itself, and trail stops to lock profits as price confirms your thesis. Applying these rules consistently gives you disciplined exits that align with your edge and risk tolerance.